- Fully mine permitted
- Feasibility study in progress
- Advantageous location: ~200 km south of Lusaka, north of Lake Kariba.
- Good Infrastructure including: road access ground water and available grid power (~60 km away).
Muntanga - Zambia
Summary
Project Description
The Muntanga Project currently comprises three mining licences and three exploration licences (Figure 1) with a total combined area of 1,225.9 km². The three mining licences – Muntanga, Dibbwi and Chirundu – encompass 720.5 km2. The mineral resources reported in the Project's Technical Report are contained within these licences.
The Muntanga and Dibbwi mining licences, which comprise the Muntanga, Dibbwi and Dibbwi East deposits, were acquired 100% by GoviEx in a share purchase agreement from Denison Mines Corporation, wholly owned subsidiary Rockgate Capital Corporation on June 2016. The Chirundu mining licence, which contains the Njame (north and south) and Gwabi uranium deposits, as well as the Kariba Valley (Chisebuka) exploration licence, were acquired 100% from AFR on October 31, 2017.
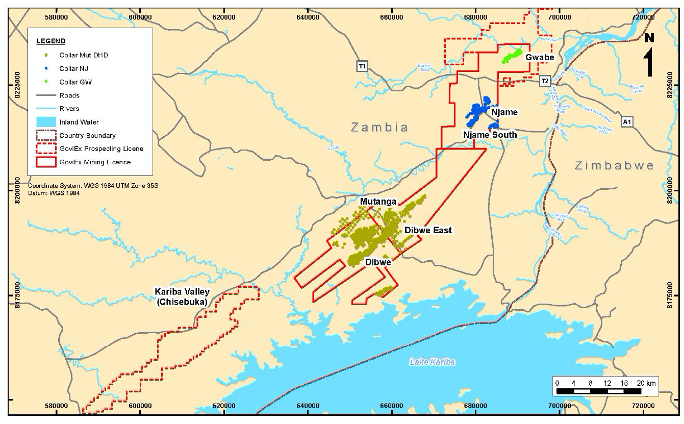
Figure 1: Location of Uranium Deposits in the GoviEx Muntanga Project
Mineral Resource Estimate
The current MRE update is the result of extensive infill drilling, including 5,980 m drilled in 2021 and a further 27,634 m of drilling in 2022 (total of 33,614 m in 262 holes). The drilling was focused predominately on the Dibbwi East deposit, to further delineate the deposit and convert Inferred resources to the Indicated category. The MRE update included a comprehensive reassessment of previous work and a revised correlation between down-hole radiometric probe data and chemical assays used to convert down-hole radiometric data into equivalent uranium grades (eU3O8) for mineral resource estimation.
The Muntanga Project contains Measured and Indicated Mineral Resources of 42.6 million tonnes at an average grade of 359 ppm U3O8, containing 33.7 million pounds of U3O8, and an Inferred Mineral Resource of 15.0 million tonnes at an average grade of 330 ppm U3O8, containing 10.9 million pounds of U3O8 in five deposits (Muntanga, Dibbwi East, Dibbwi, Gwabi, and Njame), located over 65 km strike.